

By Duke Okes
No doubt most folks in quality are familiar with gage R&R studies, more generally part of measurement system analysis in Six Sigma. Such studies usually involve having multiple people measure the same items several times, and the information provided can indicate how well the measurement system (device, people) works relative to the needed accuracy.
A version known as attribute agreement analysis (AAA) is used when the measurement involved is a go/no-go decision rather than a measured value. It is often applied to visual inspections based on a qualitative analysis of test samples. Interestingly, it could also be used to evaluate performances of auditors who must decide whether a specific situation is or is not a nonconformity (NC). Confidence in auditor decisions is an especially valid concern in high-risk processes.
To conduct such a study, a range of audit situations would be provided to the auditors. All are asked to decide whether each situation is a NC. Experts should, of course, first evaluate the situations to provide the “standard” value (NC or OK) for each. Table 1 is an example using three auditors and 20 sample cases. The first time such an analysis is performed, it might still focus a bit on validity of the test cases. In this example, there is a good chance they are valid since there is not a pattern in erroneous decisions by multiple auditors on the same question(s). Note, however, that there are more Type 2 errors (red) than Type 1 (yellow).
Statistical software can then be used to evaluate the data. It will provide ratings for: 1) each auditor against the standard, 2) each auditor compared to the other auditors, and 3) the pool of auditors to the standard. Each auditor could also be compared to him/herself if asked to evaluate each situation more than once, but their familiarity with the cases after the first time (carryover effect) is likely to impact the validity of this analysis. If the test was repeated after enough time, this effect could perhaps be reduced.
The software will typically provide the number correct and incorrect, percent correct, confidence intervals around that percent and a kappa value (like a correlation coefficient, where -1 means total disagreement and +1 means total agreement). Typically, anything .7 or less is deemed inadequate, .9 and above is good, and each organization can decide whether values between .7 and. 9 are acceptable based on their context and risk tolerance.
Table 1: Decision Data for Three Auditors (output from SigmaXL)
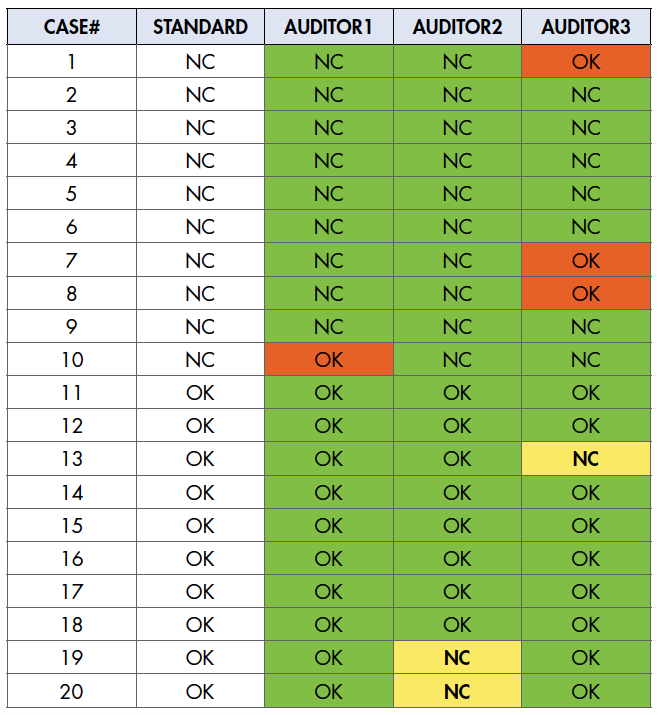
Figure 1: Summary Statistics (edited output from Minitab)
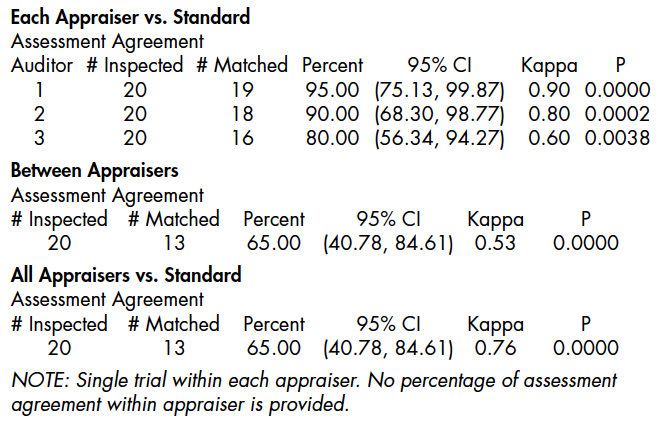
Figure 1 is a partial output from Minitab for the analysis of the data in Table 1. The conclusions that can be made are:
• Auditors 1 and 2 have acceptable kappas when compared to the standard while Auditor 3 does not.
•Auditors do not agree well with each other with a kappa of .53.
• When all auditors as a group are assessed against the standard, the kappa is .76.
Auditor 3 requires additional training or coaching, or at least oversight by another auditor. If improvement does not result, then perhaps the individual simply does not have the cognitive makeup for an auditor role. Auditor 2 might be deemed acceptable, although his/her NCs might need to be reviewed by to reduce chasing ghosts. Although Auditor 1 has a high kappa, in a high-risk industry the potential impact of a Type 2 error might be huge. Some further evaluation might still be warranted.
It is often recommended that attribute studies involve a sample size of 50, and although using a smaller sample size provides less statistical confidence, this may be acceptable for such a purely cognitive evaluation. That is, when such an analysis is conducted for people doing visual inspection (e.g., visual defects on manufactured parts, radiologists reading X-ray images), the assessment is catching potential problems with both their eyesight and interpretation. The same would be true for any testing involving the senses, such as sound, touch, smell, and taste.
When looking solely at the cognitive process, there will inherently be more noise (consider the difficulty of applying such an evaluation to a group of psychologists trying to determine whether several individuals are mentally ill).
What may be more important is ensuring that the set of sample cases is broad enough to include both clear NC, clear not NC, and a range of in-between situations. A further complication is to also cover a sufficient range of QMS content (standards to which the audits are being conducted) requirements.
Note, it is not necessary to do such a calibration check with more than one auditor. Once the standard cases have been validated, calibration of a single auditor can be checked against the standards using the same statistical analysis. Additionally, such an analysis is not limited to binary (NC or OK) conditions. If an organization uses different classifications of audit findings, either an ordinal or nominal treatment of the data can be used.
About the author
Duke Okes has been in private practice for 34 years as a trainer, consultant, writer, and speaker on quality management topics. His book titled Musings on Internal Quality Audits: Having a Greater Impact was published by ASQ Quality Press in 2017. He is an ASQ Fellow and holds certifications as a CMQ/OE, CQE, and CQA.
Copyright 2017 by Duke Okes. All rights reserved.


